This thesis contributes to a new discipline of science: web science, as introduced by Tim Berners-Lee and others in 2006. Designers, computer scientists, sociologists, cognitive scientists, psychologists etc. have individual perspectives on the complex and rapidly evolving interplay of technological and social infrastructure and human society. However, a well-defined discipline — unifying the scientific analysis of social and human factors to understand, but also to shape and steer web developments by informed design and engineering —is not established yet. I hope to contribute to an interdisciplinary dialogue between science, engineering and design with this thesis.
Interface Design Programme
University of Applied Sciences Potsdam
Moritz Stefaner, June 2007
Supervisors: Prof. Boris Müller, Prof. Danijela Djokic
Best Masters Thesis at FH Potsdam in 2007
Analysis
Guidelines
I proceed by deriving design maximes from these observations:
- Analyse and understand emerging usage patterns
- Create space and incentives for effective participation
- Distribute and share — one node in an ecology of services
- Worse is better
- Or is it? gardening and refinement
- Make the long tail accessible: new forms of contextualized navigation
- Think flat but multi–faceted
- Think temporalized
- Think intersubjective and multi–valent
- Visualization alone is not the answer
- And forget about metaphors
These guidelines and hypotheses from the analytical part were both generated and illustrated with interactive visualizations:
Interface Design experiments
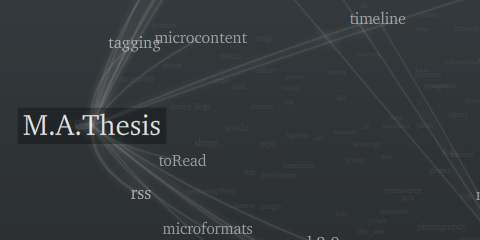
Elastic tag maps
Elastic tag maps visualize the complex relationships emerging between tags (free-form keywords used to describe digital resources). The layout algorithm puts tags that are frequently used together closer together on a 2D plane. On rollover, tags that tend to co–occur with the selected tag are brought to the front. Clicking allows to lock tags and explore their semantic context further, without losing focus.

Emerging topics
Classical tag clouds fail to show how topics appear and disappear over time. Based on a memory model, where tags “age” over time and are finally “forgotten”, if not used anymore, this visualization shows the evolution of users’ tagging vocabularies.

Folding time
What is in between a list and a linear time plot? A comparison of approaches to visualizing temporal rhythms in web feeds.
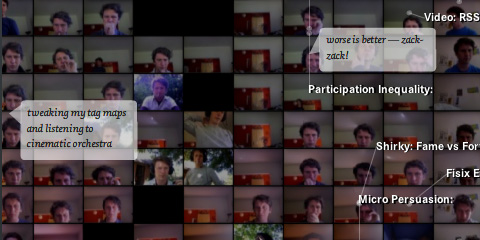
Lifestream mashup
Grounding time visualization in personal experience, and picking up the mash–up idea, a visualization of hourly webcam shots, along with his del.icio.us bookmarks and short twitter comments is combined in a unified documentation of digital activity.
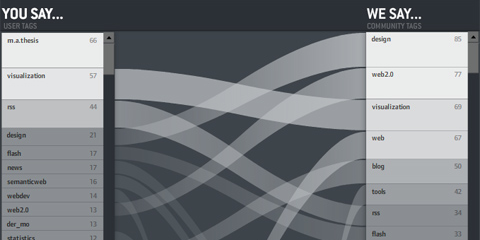
You say… we say…
How do individuals use tags — compared to the community? Do you use private language or are you a mainstream tagger? When you tag with “design” — do the others think it is “art”?

Elastic lists for facet browsers
A demonstration of the “elastic list” principle for browsing multi-facetted data structures. Click any number of list entries to query the database for a combination of the selected attributes. If you create an “impossible” configuration, your selection will be reduced until a match is possible.
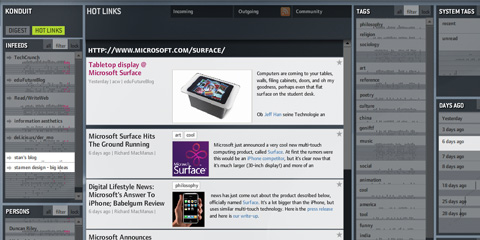
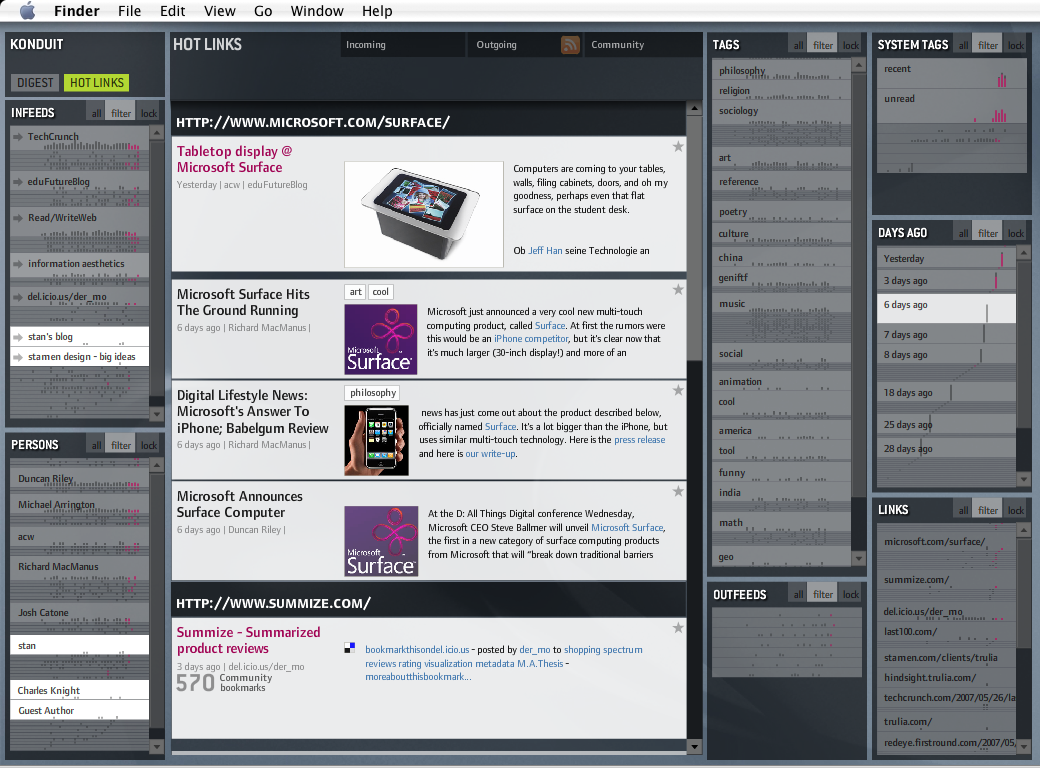
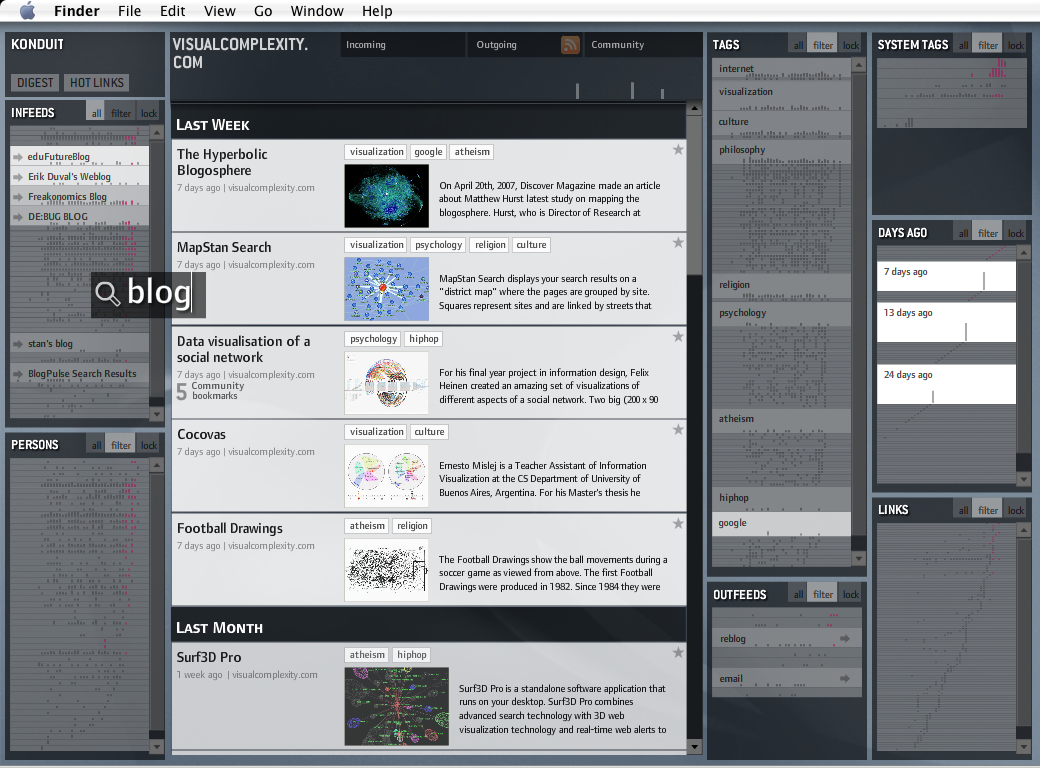
KONDUIT
A novel feed reader combining the presented principles in a desktop application. Every metadata value (such as author, date, feed, tag) has an intrinsic temporal dimension and is activated or collapsed according to the current selection context. Conceptually, every metadata value or action in the application is treated as a feed (or tag, respectively), which are in turn grouped in facets.
More
You can find more info and comments at the thesis page ofwell–formed–data, the blog that accompanied the development of this thesis.